The US stock market has been on a rollercoaster during President Donald Trump’s second term. The S&P 500 posted its third-worst 100-day start to a presidential term in US history, only behind Gerald Ford and Richard Nixon. The S&P 500 initially surged after Trump’s reelection in November on expectations for a pro-business boom. Yet as the president unveiled his plan for tariffs and has gone back and forth on trade policy, Wall Street has been shaken by historic levels of uncertainty and volatility. CNN is tracking the S&P 500’s performance each day across Trump’s second term to see how it compares to past presidents since World War II. As the benchmark US stock index, the S&P 500 tracks the 500 biggest public companies in the United States by market value. Even if you don’t own individual stocks, retirement plans like 401(k)s are invested funds that track the S&P 500, meaning you might be invested in these top companies through your employer. About 62% of US adults held stocks in 2024, whether through an individual stock, a mutual fund or a retirement savings account, according to an annual Gallup survey. Since the end of World War II, the S&P returned an average of 2.1% during a president’s first 100 days, according to Sam Stovall, chief investment strategist at CFRA Research. An above-average return for the S&P during a president’s first 100 days corresponded with an average gain that year of 21.1%. Meanwhile, a below-average return for the S&P during a president’s first 100 days corresponded with an average loss that year of 5.5%. “History is a guide, but it’s never gospel,” Stovall said. Investors this year will be focused on how Trump’s tariffs might continue to impact the economy and markets. “I think a lot of people on Wall Street were expecting tariffs to be more rhetoric than reality,” Stovall said. “In fact, it ended up being reality. We have yet to find out what the longer-term outcome will be.”
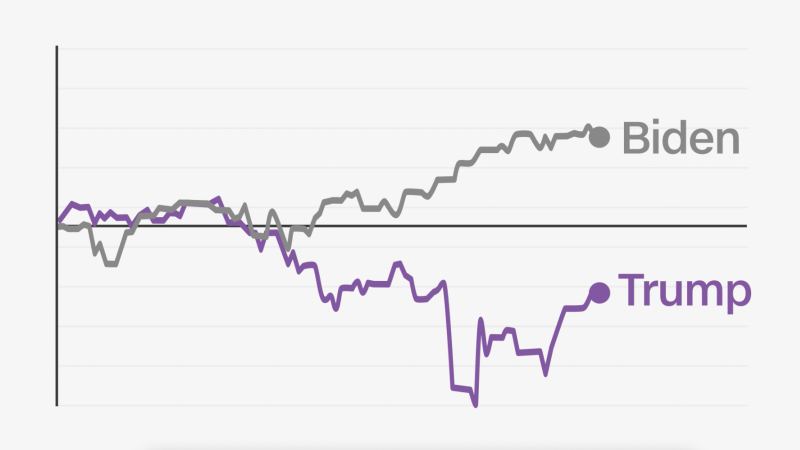
Comparing stock market trends under Trump, Biden and other recent presidents
TruthLens AI Suggested Headline:
"Analysis of Stock Market Trends During Trump's Second Term Compared to Previous Presidents"
 CNN
7.4
CNN
7.4
TruthLens AI Summary
During President Donald Trump's second term, the U.S. stock market experienced significant volatility, particularly evident in the performance of the S&P 500. This index, which tracks the stock performance of the 500 largest public companies in the United States, recorded its third-worst start in history for a president's first 100 days, following only the administrations of Gerald Ford and Richard Nixon. Following Trump's reelection in November, the market initially rallied on the anticipation of a pro-business environment. However, uncertainty regarding Trump's trade policies, especially the announcement of tariffs, created turmoil in the markets. CNN has been monitoring the S&P 500's daily performance throughout Trump's second term to draw comparisons with the stock market trends observed under previous presidents since World War II, reflecting the broader implications of presidential policies on market performance.
The stock market's behavior during a president's initial days in office often serves as an indicator of potential economic trends for the year ahead. Historically, the S&P 500 has yielded an average return of 2.1% during the first 100 days of a presidency, correlating with an average annual gain of 21.1% for above-average returns. Conversely, below-average returns have been associated with average annual losses of 5.5%. Sam Stovall, chief investment strategist at CFRA Research, emphasizes that while history provides valuable insights, it should not be viewed as definitive. As the year progresses, investors remain cautious about how Trump's tariffs will influence both the economy and market dynamics. Stovall noted that many on Wall Street initially perceived Trump's tariff threats as mere rhetoric, but the reality of their implementation has raised concerns about long-term economic impacts that remain to be seen.
TruthLens AI Analysis
The article examines the fluctuating performance of the US stock market during President Donald Trump's second term, particularly the S&P 500 index, and compares it with previous presidents. It highlights the initial surge in the stock market after Trump's reelection, followed by uncertainty due to his trade policies and tariffs. The piece emphasizes the historical context of stock market performance during presidential terms and suggests that current investors are concerned about the implications of Trump's tariffs on the economy.
Purpose and Intentions
The article aims to provide insights into how the stock market behaves under different presidential administrations, particularly focusing on the volatility experienced during Trump’s second term. By drawing comparisons with historical data, it seeks to inform investors and the general public about the potential implications of political decisions on market stability and growth.
Public Perception
The article may be attempting to cultivate a sense of caution among investors regarding the unpredictable nature of the stock market in response to political actions. By presenting historical trends alongside current events, it portrays the notion that the stock market's health is closely tied to presidential policies, potentially influencing public sentiment about Trump's leadership.
Omissions and Hidden Aspects
While the article provides valuable insights, it may downplay the broader economic factors influencing the stock market, such as global trends, monetary policy, and external economic conditions. This focus on presidential impact might obscure the complexity of market dynamics, leading readers to attribute stock performance primarily to political decisions.
Manipulative Elements
The article does not overtly display manipulation but does steer readers towards a narrative that associates economic instability with specific presidential actions. The language used suggests a causal relationship between Trump’s tariffs and market performance, which could lead to biased interpretations of economic events.
Trustworthiness of Information
The article relies on historical data and expert commentary, which lends it credibility. However, the selective focus on certain aspects of stock performance might skew the reader's understanding of the broader economic landscape. It presents data accurately but could benefit from a more nuanced discussion of other influencing factors.
Societal Impact
This analysis could lead to increased caution among investors and might influence public discourse about economic management under different administrations. If the stock market continues to exhibit volatility, it may further entrench skepticism towards Trump’s economic policies among the electorate.
Target Audience
The article primarily appeals to investors and individuals with an interest in economic trends, particularly those who are impacted by stock market fluctuations, such as 401(k) holders. It aims to engage a financially literate audience that seeks to understand the implications of political decisions on personal investments.
Market Influence
The article could affect investor sentiment, particularly towards companies heavily impacted by tariffs or trade policies. Stocks in sectors such as manufacturing, technology, and agriculture might experience heightened scrutiny from investors reacting to this news.
Global Context
In terms of global power dynamics, the implications of US trade policies can affect international markets and economic relationships. The focus on tariffs and their impact on the economy is particularly relevant in today's discussions about globalization and trade.
Use of AI in Article Composition
It is plausible that AI technologies could have been employed in the drafting or analysis of the stock market data presented in the article. Models trained on historical economic data might assist in drawing correlations and trends, influencing the narrative direction by emphasizing certain statistics or expert opinions.
In conclusion, while the article offers a factual basis for understanding stock market trends under Trump, its focus on presidential impact could mislead readers regarding the multifaceted nature of economic performance. The selective presentation of information warrants cautious interpretation, as it may foster a simplistic view of a complex economic reality.