No more ‘subway spaghetti’! New Yorkers adjust to first new transit map in 50 years

TruthLens AI Suggested Headline:

"New York City Unveils First Major Subway Map Update in Nearly 50 Years"

View Raw Article Source (External Link)
Raw Article Publish Date:
AI Analysis Average Score: 8.2
These scores (0-10 scale) are generated by Truthlens AI's analysis, assessing the article's objectivity, accuracy, and transparency. Higher scores indicate better alignment with journalistic standards. Hover over chart points for metric details.

TruthLens AI Summary

The New York City subway map has long been a complex and sometimes confusing guide for both residents and visitors. Unlike the subway maps of other major cities, such as London or Tokyo, which often prioritize clarity over geographic accuracy, the traditional New York map retains a semblance of the city’s layout. Key landmarks such as Central Park and the various boroughs are depicted, creating a visually rich but intricate web of subway lines that can be daunting for newcomers. This month, the Metropolitan Transit Authority (MTA) introduced a new subway diagram, the first significant update in nearly 50 years. The redesigned map simplifies the representation of the city by opting for a more geometric approach, with clearer lines for each train and a less detailed depiction of the geographic features. The new diagram aims to present essential travel information in a straightforward and visually appealing manner, reminiscent of the controversial 1972 Unimark map created by Massimo Vignelli, which had met with mixed reactions from New Yorkers due to its abstraction and modern aesthetic.

The development of the new map reflects a decade of thoughtful design work and a desire to reconcile the needs of riders with the complexities of New York's geography. Unlike in many other cities where subway maps can distort reality for simplicity, New Yorkers are accustomed to a layout that closely mirrors the grid of streets, thus making it challenging for cartographers. As such, the new map attempts to blend the advantages of both diagrammatic and geographic styles, striving for clarity while acknowledging the unique characteristics of the city. Initial reactions to the redesign have been varied; while some have praised its modern look, others remain skeptical, expressing concerns about its usability compared to the older version. The new map's reception underscores the broader theme of New Yorkers' resistance to change, particularly regarding iconic elements of the city. The success of the new design ultimately hinges on its ability to help riders navigate effectively, regardless of the aesthetic preferences that may evolve over time.

TruthLens AI Analysis

The introduction of a new subway map in New York City, the first major overhaul in nearly 50 years, reflects a significant shift in urban transit design aimed at improving usability for commuters and tourists alike. This change not only represents a practical update but also serves to influence public perception of the city's transit system amidst ongoing discussions about urban infrastructure and accessibility.

Public Perception and Community Response

By simplifying the subway map, the Metropolitan Transit Authority (MTA) aims to make the system more user-friendly, particularly for newcomers. The visual clarity of the new design contrasts with the previous map's complexity, which could deter usage. This initiative could foster a more positive view of public transport in New York, encouraging more people to use the system and thereby supporting broader urban mobility goals.

Transparency and Hidden Agendas

While the announcement focuses on design improvements, it could divert attention from other pressing issues, such as ongoing budget concerns or service reliability. By emphasizing a positive change, the MTA may seek to improve its public image amidst criticisms about funding and service quality. This could be seen as an attempt to distract from potential underlying problems.

Trustworthiness of the News

The article appears to be reliable, drawing from statements made by the MTA and reflecting on historical context regarding subway map designs. The mention of past controversies about subway map aesthetics indicates a well-rounded approach to the topic. However, it is essential to recognize that the framing of this change as a purely positive development can gloss over the complexities involved in public transportation management.

Social and Economic Implications

The redesign could positively impact the community by making public transit more accessible, potentially leading to increased ridership. This, in turn, may stimulate local economies as more people use public transport to access businesses and services. However, if the changes do not address deeper issues, such as overcrowding or service delays, they may not lead to the anticipated economic growth.

Target Audience

The article likely appeals to urban dwellers, commuters, and visitors to New York City, particularly those who may have previously found the subway system intimidating. It also seeks to engage design enthusiasts and those interested in urban planning, as it connects to larger conversations about transportation design worldwide.

Market Impact

The subway system's improvements could influence companies related to urban infrastructure, public transportation services, and city planning. Stocks associated with these industries may see fluctuations based on the public's response to the new map and its implications for ridership and service improvements.

Geopolitical Relevance

While the article focuses on a local issue, it indirectly ties into broader discussions about urban sustainability and public transportation, relevant in the context of global climate initiatives and urbanization trends. The efficacy of public transit systems is a critical factor in addressing environmental concerns, which is increasingly a topic of global significance.

Artificial Intelligence Influence

There is no direct indication that AI was used in the creation of the article itself. However, the language and formatting suggest that AI models could assist in generating similar content, especially in structuring complex information in a reader-friendly manner. If AI were involved, it might influence the clarity and accessibility of the information presented.

In summary, while the news highlights a significant update to New York City's subway system, it is essential to view it within the broader context of public perception, urban infrastructure challenges, and potential economic effects. The article effectively communicates the intended message, though it may also serve to mask deeper issues within the MTA's operational framework.

Unanalyzed Article Content

TheNew York Citysubway map has always been tricky to decipher. Unlike those in cities from Boston to London toTokyo, the longstanding New York map hews fairly closely to the image of the city aboveground.

Central Park is clearly depicted, as are the individual bodies of water within it; you can see the shape of each borough and the rivers and ocean framing them. Overlaid across it all is a tangled web of subway lines, daunting to the first-time visitor – especially when it comes to distinguishing between local and express trains.

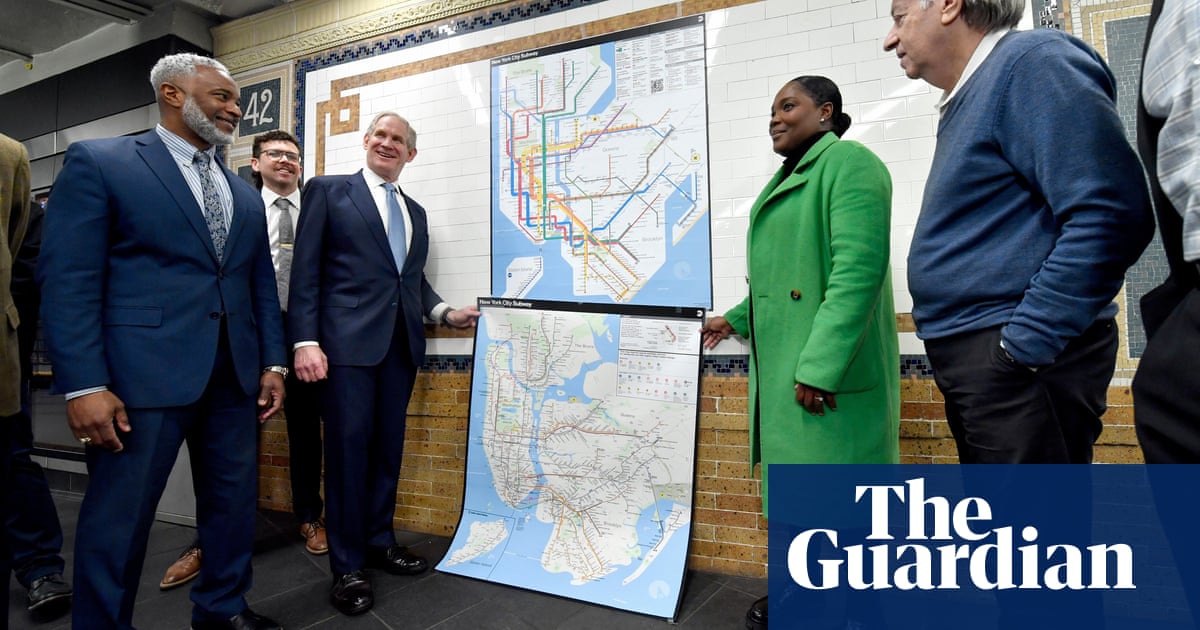
For the first time in nearly 50 years, that is changing. This month, the city’s Metropolitan Transit Authority (MTA) revealed a new map – or, perhaps more properly,a new diagram– that lays out the system more geometrically.

The outlines of the boroughs are still there, but far more simplified. Central Park has been reduced to a greenish square. The subway lines themselves, meanwhile, are far bolder and clearer, with separate paths shown for each train. The overlapping A, C and E trains, for instance, once shared a single blue line with tiny letters denoting which train stopped where. Now they form a thick blue trio that branches out when the lines separate.

According to the MTA, the new diagram, the first major overhaul since 1979, seeks to simplify the image while offering “the most essential travel information in an easily readable, bright, bold, and orderly manner”. It hearkens back to adivisive predecessor: Massimo Vignelli’s 1972 diagram, known as the Unimark map, which firmly prioritized legibility for subway riders over an accurate representation of the New York landscape. Vignelli is something of a design hero, havinghelped shape the whole lookof the subway system. But many New Yorkers hated his map, and it was gone by 1979, replaced by an early version of the Tauranac/Hertz map – the one you know if you visited the city before 2 April.

Still, the Unimark map is far closer to the feel of many other cities’ subway diagrams, which offer virtually no sense of what a city actually looks like. London’s Tube map, designed in the 1930s by Harry Beck – whomVignelli calledthe “father of all contemporary kinds of subway maps” – is known for its beauty and its total irrelevance to reality. As Bill Bryson has pointed out, a touristreading Beck’s mapand trying to get from Bank to Mansion House could ride two lines and six stops – or walk 200ft down the street.

So if these diagrams work perfectly well elsewhere, why were New Yorkers so frustrated with Vignelli’s attempt? According to the writer and mapmaker Jake Berman, the author ofThe Lost Subways of North America: A Cartographic Guide to the Past, Present and What Might Have Been, the answer lies in part in the grid layout of most Manhattan streets.

If you want to go from 51st Street and Sixth Avenue to 42nd and Fifth, it’s easy to calculate that you need to go nine blocks downtown and one block east. That creates “a unique challenge for a cartographer trying to illustrateNew York, because everybody knows where everything is”, Berman says.

“When you’re designing a transit map, the standard way, as in London or Madrid or Paris, is to distort the geography so that the transit network makes sense and it straightens out the spaghetti of the subway line into something intelligible.” In many cities, the streets are so confusing that it doesn’t matter if the subway diagram doesn’t match. But in New York, “if you show Second Avenue to the east of First Avenue, you’re going to look at the map and say: ‘What is this?’”

On top of all that, some disliked the Unimark map’s modern look and its colors. “I showed it to my mom and she said: ‘Why is the water brown?’” Berman says.

But Vignelli’s wasn’t the first New York subway map to opt for the diagrammatic approach. In fact, the New York City Transit Authority’s first map, which came out in 1958, did the same, according to Jodi Shapiro, the curator of the New York Transit Museum, a self-sustaining division of the MTA. (Maps existed before then, but they were largely the domain of third-party companies.) The map, Shapiro says, is “always a work in progress”, a “living document”. While it’s been decades since a major change, the existing map was constantly being tweaked. And the new map didn’t suddenly spring to life – it was the product of a decade of work, Shapiro says. “There’s always been two sides of thinking about which is a better map for New York? Is it a diagram, or is it an actual geographic map?”

She surmises that the designers of the new version sought to pull the best ideas from both versions. Will New Yorkers like it? Shapiro expects it to be divisive. “Old ideas die very, very hard in New York, especially in the transit system,” Shapiro says.

Indeed, one of the first passengers to lay eyes on the design gave the New York Times a middling review: “Meh.” But some New York rail fans have been enthusiastic: “I like it. Looks like a map made out of multicolored computer wires,”wrote oneReddit user. “Love that the Vignelli map is back,”wrote another.

Athird said: “Vignelli-style diagram is better for understanding how to navigate from one station to another, but worse for understanding where stations are relative to real-world destinations … Maybe that’s okay. People don’t navigate the same way in 2025 that they did in 1979.”

Berman echoed that point: the shift may mean New York is ready for the kind of map it dismissed in the 70s. Today, “everyone has Google Maps on their phone so they can adjust once they’ve come above ground,” Berman says. And “on the design front, at least the water is blue and the parks are green.” It might also help that the Vignelli map has achieved a quasi-legendary status, having earned aplace in New York’s Museum of Modern Art.

Still, this is New York, so the map is bound to take some getting used to. “New Yorkers will complain about anything. It’s the municipal sport,” Berman says.

Shapiro agrees. “New Yorkers are kind of not cool with change at the outset – for the first couple of days, everybody is up in arms,” whether the change is to subway maps or Nathan’s french fries. But in the end, “does it help people get to where they want to go? If it does that job, then it’s a success, no matter what you think of the aesthetics.”

Back to Home
Source: The Guardian